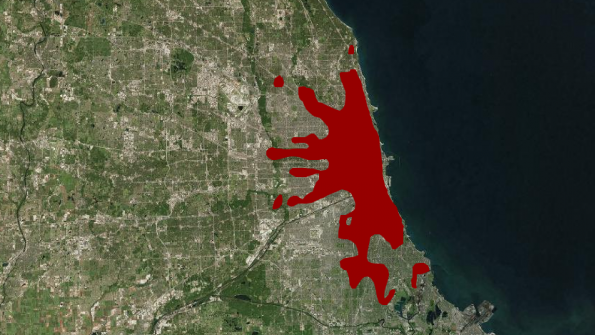
Interactive tool maps urban expansion through history
A new interactive tool allows users to track the growth of 10 of the world’s largest cities throughout the years.
Developed by esri, an online “storymapping” solution, The Age of Megacities allows users to visualize the growth of the world’s largest urban centers. Two American cities are included; users can see the footprint of Chicago grow from 1893 to today and Los Angles expand from 1907 to present.
Chicago’s population tripled from 1850 to 1860 due to industrial and railroad activity, according to the map. Los Angeles’ growth was due in part to a marketing campaign that painted L.A. as a luxurious paradise in the late 1800s. The rise of the automobile and a booming middle class also fueled L.A.’s growth during the roaring '20s.
Citing United Nations projections, The Age of Megacities reports the world will have 41 megacities – or those with a population greater than 10 million – by 2050. By this time, 66 percent of the world population will live in urban areas.
The fastest growth is happening in Africa and Asia, according to the map. Cities expected to pass the 10-million threshold in the next 10 years include Kinshasa, in the Democratic Republic of Congo; Shenzhen, China; Chonquin, China; Guanzhou China; and Lahore, Pakistan.
_____________
To get connected and stay up-to-date with similar content from American City & County:
Like us on Facebook
Follow us on Twitter
Watch us on Youtube


