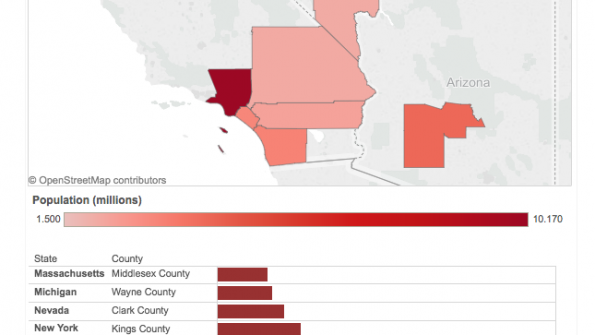
Infographic: The largest, fastest growing and most employed counties
The U.S. population grew from 308 million in 2010 to 321 million between 2010 and 2015, according to the U.S. Census Bureau. In the interactive data set below, you can see the most populous U.S. counties in 2015 as well as the U.S. counties that had the fastest growth between 2010 and 2015. You can also see which counties had the lowest unemployment rates as of March 2016, per the Bureau of Economic Analysis.
Hover over the maps' highlighted areas and the bars in the charts to view population info and location. Navigate the maps by using the pan tool in the window and clicking and dragging. Should a map freeze, click "reset" at the bottom of the set.


