Your IT Spend is 50 Percent More Than You Think
How data quality and consistency issues impact procurement teams’ spend visibility and how those issues can create problems when trying to use analytics to make strategic and tactical procurement decisions was covered in previous articles. In this article, I want to highlight a specific example that frames the data quality issue in a way that has proven to be relevant to nearly every procurement organization, Chief Technology Officer and Chief Information Officer I’ve worked with.
It starts with a simple question – how much do you think your organization spends on Information Technology? When you have your initial answer or estimate, add 50 percent and you might be getting close. In some cases, double it or triple it and you’ll be right. In nearly all cases where your answer or estimate of spend is based on your general ledger codes and/or data directly out of a financial management system, you’ll be wrong. And, the lack of accurate visibility in this area will be impacting more than just spending decisions and missed savings opportunities.
Size and importance of IT spend
Across public sector organizations, both spend value and transaction counts on information technology purchases rank in the top 5 out of 30 across every type of public sector organization. It’s an important category to all organizations, and its importance continues to grow. It is a category which is ripe for strategic pushes to get the most value out of every dollar spent, but it’s also one that, left under-managed, can expose the organization to security risks. But as you’ll see in the examples below, it is also one of the categories of spend where it’s most difficult to get accurate visibility.
When is spend IT spend?
The data quality challenge is often created because classifying spend consistently and correctly is difficult. There is frequently no carrot or stick big enough to get the people who actually spend your organization’s money to classify what they bought in a useful way consistently. Is buying a printer “Information Technology” or “Office Supplies”? Is spend with an IT consultant “Information Technology” or “Professional Services”? How much IT spend is buried in “Other Services” or “Miscellaneous” in your general ledger codes? How much IT spend is going through credit cards where many organizations don’t have the level of visibility they would like? All of these factors and more contribute to the disconnect between IT spend figures based on general ledger codes and actual IT spend as laid out below.
What is Shadow IT and how big is the problem?
Shadow IT spend is spend on information technology hardware, software and services (consulting, telecommunications, SaaS services) that goes on without the knowledge of the procurement team or oversight by the IT function.
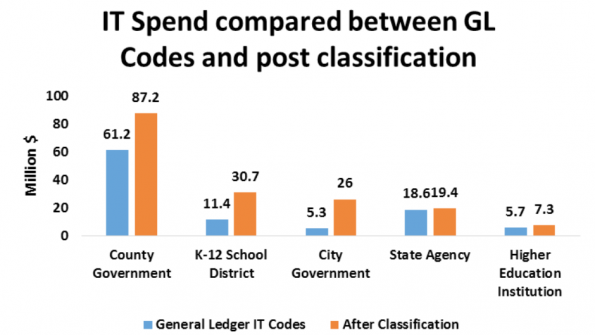
In one example of Shadow IT at a large K-12 school district, the difference between spend on IT by general ledger code and the actual spend following a spend analysis exercise was $19.7m in one year – nearly a 3x difference for that organization. That’s a problem, especially if like other K-12 school districts, Information Technology spend is its second highest expenditure category over the course of a financial year, second only to construction.
The data challenge is certainly not specific to K-12 school districts. It affects local government, higher education and state government agencies alike. In the example below, the state agency whose data was used as an example was pretty close – small in percentage terms, but still an $800,000 gap.
Why is Shadow IT a big deal?
There are implications both to procurement teams as well as to the CIO/CTO’s office of Shadow IT spend. From a procurement perspective, the most obvious benefit that previously invisible IT spend represents is the opportunity to bring more to the table in supplier negotiations, bring more spend under management, increase throughput on an established contract, increased contract compliance and a reduction in maverick expenditures. All of these contribute to the organization’s goal of getting the most value out of every dollar it spends. Every dollar of shadow IT spend is potentially costing the organization more in the up-front costs for that hardware, software or service.
On the CIO/CTO side, every dollar of Shadow IT spend potentially costs the organization more in internal support and maintenance costs because those people who purchase unsanctioned hardware, software or services still expect the organization’s help desk to support whatever it was they purchased. Potentially even more critical is that Shadow IT spend on hardware can create potentially hackable end points because firmware is not updated and security patches are not installed automatically. Use of unauthorized cloud services could result in HIPAA or other private data not being secured properly. Visibility of Shadow IT spend gives the CIO/CTO’s office the opportunity to identify any of the issues above, but also gives them the opportunity to find out where the current services provided are not meeting the organization’s needs and partner with those departments to make the organization more efficient.
A robust and comprehensive spend analytics program can shine a light on what was dark. It requires some effort, but as IT expenditure is only likely to increase in the future and the number of easy-to-download apps, cloud services and hardware options increases, it should be moving up the priority list of both procurement and IT teams in public sector organizations.
Jonathan White, Director, Business Development (Americas), Spikes Cavell, part of DXC Technology; 1775 Tysons Blvd., Suite 900 Tysons, Va. 22102; (571) 313-5257 ext. 102; [email protected].
_____________
To get connected and stay up-to-date with similar content from American City & County:
Like us on Facebook
Follow us on Twitter
Watch us on YouTube


