GIS tool helps Golden State city win planning grant
Fullerton, Calif., has landed $270,000 in California Department of Transportation (Caltrans) planning funding, thanks to a geographic information system (GIS) that provided key answers for the grant application.
Esri Community Analyst, a cloud-based GIS from Redlands, Calif.-based Esri, produced reports and supplied data that were needed to fill out the application.
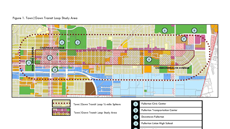
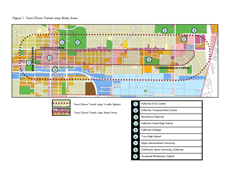
The planning funds will be used to explore options for a transit loop extension, including a fixed-route trolley, in the downtown area.
“Community Analyst provided answers to questions we couldn’t have easily found otherwise,” said Diana McCarthy, a GIS specialist in the city’s Community Development Department (CDD). “We were able to access data across several census block groups, nailing down information to a very specific area.”
To accomplish this, CDD staff created a unique quarter-mile sphere of the proposed study area to accurately identify information, such as the types of population potentially served and the number of single-occupant vehicles passing through the area. Using the GIS product, city staff obtained information about existing businesses, determined what types were missing, and created a plan to draw new establishments into the area.
With six colleges and universities and eight high schools in Fullerton, the city has numerous students and faculty who could benefit from targeted transportation. The proposed transit loop would give students and all residents access to the trolley from the existing transit center, which provides access to the Metrolink commuter rail systemand Amtrak trains, as well as Orange County transit buses.
“Community Analyst created a vehicle for collaboration. [It’s a tool] that officials could use to actively engage citizens, including those involved in local high schools and universities, and help them encourage students to use alternative modes of transportation,” said Chris Thomas, Esri director of government markets.
Using Community Analyst, a hosted cloud solution, Fullerton CDD staff was able to:
—View the latest American Community Survey variables on a thematic map.
—Use comparison reports to determine which improvements should be funded, and the impact of those decisions on populations and households.
—Find optimal locations for the improvements to serve the most people.
Esri GIS technology and software is used in mapping and spatial analysis. More than 300,000 organizations worldwide, including the 200 largest cities in the U.S., use the technology.